SmugMug 2009, comparison with Flickr
Introduction
As you may know, I have left the Flickr service, where I had a Pro Account, for more than one year (in December 2008). Actually, I haven’t deactivated my Flickr account, it is “just” a normal account now, as I didn’t want to break different links on my photostreams. Some limitations are now appearing on my Flickr, i.e.:
- upload of 100 MB monthly and 10MB per photo
- 2 videos per month
- only smaller resized picture accessible
- only the most recent 200 photos are shown.
So, it is clear that I cannot use anymore this service. On the other side, it’s free!
Comparison Flickr vs. SmugMug
So let’s compare a bit more the different services (SmugMug and Flickr).
Disclaimer: this comparison is a mix of facts and my own subjective rating of both services (still as users from both during months).
| CORPORATE | FLICKR | SMUGMUG |
| Overall information | sold to Yahoo! in March 2005, founders left in 2008 | independent, profitable and debt-free |
| Number of employees | around 50 | 50 |
| Number of photos | 4’000 million | 766 million |
| Founding year | 2004 | 2002 |
| STANDARD SERVICE | FLICKR | SMUGMUG |
| monthly upload limit | 100 MB | unlimited |
| limit per photo | 10 MB | 12 MB |
| max. video duration | 90s | not supported in “standard” |
| max. video size | 150 MB | not supported in “standard” |
| shown size (photo) | smaller resized images | no reducing resolution |
| number of photos shown | last 200 | unlimited |
| gallery personalization | no | yes, very nice |
| slideshows | yes, but limited | yes, lots of customization possible |
| costs per year | free, but with ads | $40 |
| PRO SERVICE | FLICKR | SMUGMUG |
| monthly upload limit | unlimited | unlimited |
| limit per photo | 20 MB | 24 MB |
| max. video duration | 90s | 10 mn |
| max. video size | 500 MB | 600 MB |
| HD supported | 720p | 1080p |
| storage limit | unlimited | unlimited |
| bandwidth limit | unlimited | unlimited |
| statistics | yes | yes (far better) |
| customization | no | fully, including hostname |
| batch organization | yes, but limited | yes, extremely powerful |
| costs per year | $25 | $150 (an intermediary “Power” level exists for $60/year) |
I am wondering, based on this tables, if it would not have been better to compare the “Pro” service from Flickr with the “Standard” level of SmugMug…
Anyway, you feel perhaps how far both services are different. Perhaps also not with the same target groups/segmentation of customers.
Why I have left Flickr
I have left Flickr for mainly three reasons:
- The huge functional differences between Flickr and SmugMug
- The lack of innovation and service updates at Flickr. In the last months, nothing happened at Flickr. SmugMug is principally launching new functions and testing new ideas each month!
- I was impacting by all the controversies and censorship stories (Thomas Hawk is relating some of them here and here) around Yahoo!/Flickr.
It is clear that the price differences is really huge between both services, but you get something from what you are paying!
Impact of having moved to SmugMug
First, it was quite easy to migrate from Flickr to SmugMug, as you can find a Firefox extension to automatically migrate all your pictures from your Flickr account to SmugMug. The tool is called “SmuggLr” and it is free.
Secondly, based on my SmugMug Pro Account, I have created a new subdomain called “visuals.didierbeck.com” of my own blog “www.didierbeck.com”. Both are now similar from each others, although I am definitely not finished with the customization. I will perhaps also merge both (blog and visuals) in the coming time. All my pictures and videos are now published under the “visuals” subdomains.
Thirdly, and perhaps the most interesting: the effect of having done these changes had a *huge* impact on the traffic of my pictures! I had about 18’000 views on my Flickr pictures within 2 years. I was many times above 100’000 views per month in 2009 on SmugMug! More data about this just below.
Some statistics of my SmugMug in 2009
Some data about 2009 on visuals.didierbeck.com:
- Number of image views: 755’000
- Monthly average in the last 6 months: 105’000
- Number of image views linked with Saint Barth: 620’000 (!), i.e. 82% of the overall views (!!)
- Highest traffic in December with more than 130’000 image views
- Highest image views in a day (since mid November): December 6 with 18’910 views in one day…
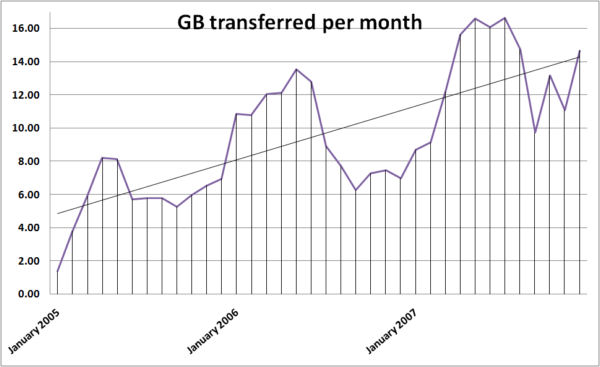
- Bandwidth used during the year: 82 GB
- Highest bandwidth usage in July with more than 20 GB
- Most viewed photo since mid November (with about 8’500 views just on this one):

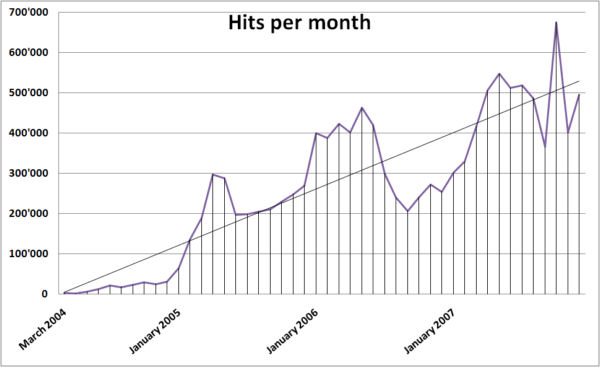
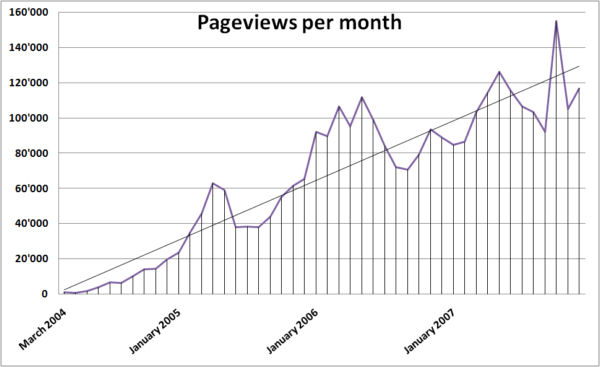
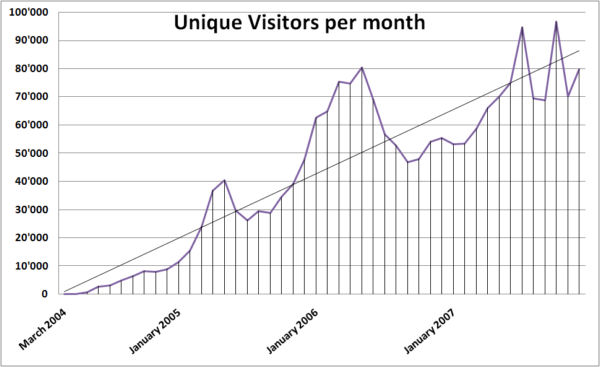
Visualization of the traffic during the last 12 months:

Labels: audience, blog, communication, flickr, picture, private, saint barth, saint barts, smugmug, statistics